
How to Create a GRADE Summary of Findings Table for a Systematic Review
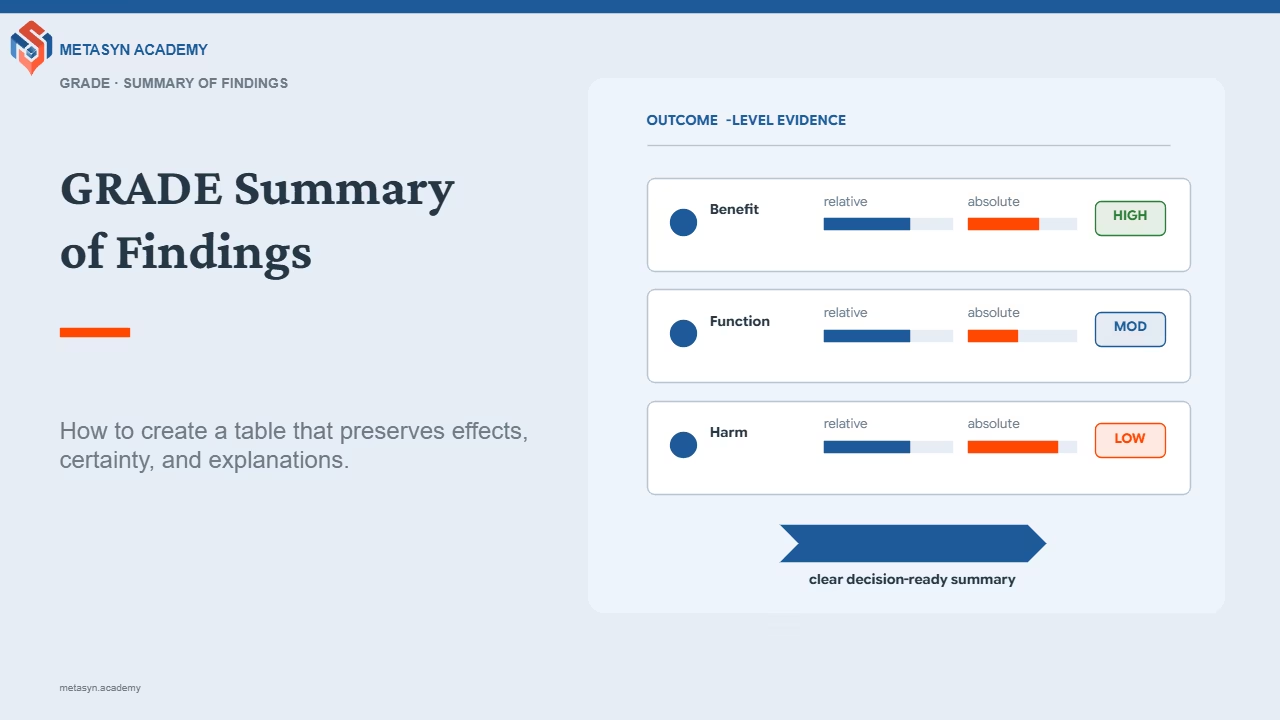
Creating a GRADE Summary of Findings table is not mainly a formatting exercise. The visible table is the endpoint of several methodological decisions: which outcomes deserve priority, how the effect should be expressed, which baseline risk represents the target population, how certainty is judged, and how much of that reasoning must remain visible to the reader.1,2
A conventional results table can report pooled estimates accurately and still make interpretation difficult. It may show relative effects without indicating the underlying event risk, mix outcomes of different importance, omit the certainty of evidence, or provide a certainty label without explaining why confidence was reduced. A Summary of Findings (SoF) table is designed to solve this communication problem by combining effect estimates and outcome-level certainty in one structured display.1,3
Empirical work supports the distinction. In randomized evaluations, adding SoF tables improved readers’ understanding and substantially reduced the time required to locate key results; later format-testing studies also found that presentation choices can materially change comprehension of risk differences and certainty.4,12 These studies do not define GRADE methodology, but they explain why the format is treated as a decision-facing evidence summary rather than a decorative appendix.
1. Start with outcomes, not with statistically attractive results
The first decision precedes table construction. GRADE guidance expects the review team to identify critical and important outcomes independently of the observed results. The usual SoF table contains seven or fewer such outcomes. This is a communication ceiling, not a requirement to populate seven rows.2,5
This ordering protects against a subtle form of outcome-selection bias. If authors decide which outcomes deserve prominence only after seeing effect size, precision or statistical significance, the table no longer reflects the original decision problem. The outcomes most important to patients or other decision-makers may be less statistically impressive than surrogate or intermediate outcomes, but that does not make them less relevant.
Surrogate outcomes need particular care. When evidence for a patient-important outcome is unavailable and a surrogate is used instead, the substitution should be explicit. A biomarker or physiological measure should not be presented as though it were itself the health outcome the reader ultimately cares about.5
Critical outcome
Important enough that the evidence for this outcome can materially influence the interpretation or decision.
Important outcome
Relevant to the evidence question and worth communicating, even if it is not usually decisive on its own.
Surrogate outcome
An indirect substitute for a patient-important outcome. The substitution and its limitations should be visible.
Outcome specification
Time point, instrument, scale, direction and units should be clear whenever they change how the result is interpreted.
2. Present the absolute consequence, not only the relative effect
For binary outcomes, relative effects such as risk ratios often transfer more consistently across populations than absolute effects. Yet relative effects are not sufficient for interpretation because the same risk ratio can imply very different numbers of events depending on baseline risk. GRADE therefore combines the relative effect with a baseline or comparator risk to derive an absolute effect for the target population.5
Core GRADE 6 makes this point more explicit than the classic guidance by foregrounding risk differences in the presentation of binary outcomes. The practical implication is not that relative effects become unimportant. It is that the table should answer two different questions: how large is the proportional effect? and what does that effect mean in absolute terms for people at this baseline risk?1
Choosing the baseline risk
The comparator risk should be plausible for the population in which the table will be interpreted. A median control-group risk from included trials can be useful, but it should not be accepted automatically if the target population differs from the trial populations. When clinically credible subgroups have substantially different baseline risks, presenting more than one baseline risk can be more informative than forcing everyone into one average value.1
Continuous outcomes require a different interpretive problem
When all studies use an interpretable common scale, a mean difference can often be presented directly. When studies measure the same construct with different instruments, standardized mean differences permit synthesis but are harder to interpret. GRADE guidance therefore discusses re-expression into a familiar instrument, minimally important difference units and other approaches that restore meaning to the effect estimate.8 The SoF table should not make an SMD look more clinically intuitive than it is.
3. Certainty belongs to the outcome, not to the study or the whole review
Current Core GRADE describes certainty as confidence in where the true effect lies in relation to the target of the assessment. The four categories remain high, moderate, low and very low. The rating is made for the body of evidence contributing to a specified outcome, so different outcomes within the same review may legitimately receive different ratings.6,7
The compact SoF table normally shows the final certainty category, not a separate visible column for every domain. Detailed judgments about risk of bias, inconsistency, indirectness, imprecision, publication bias and relevant rating-up considerations belong in the evidence profile or certainty-assessment worksheet. The table communicates the result of that process and uses explanatory notes to preserve the main reasons.3,9
| Feature | Evidence profile | Summary of Findings table |
|---|---|---|
| Primary function | Preserve the detailed certainty assessment and domain-level rationale. | Communicate the prioritized outcomes, effects and final certainty concisely. |
| GRADE domain detail | Visible for each domain and outcome. | Usually summarized through the final certainty category and explanatory footnotes. |
| Audience | Review team, methodologists, guideline developers and auditors. | Readers who need rapid access to the most decision-relevant findings. |
| Relationship | Supplies the audit trail. | Supplies the compact communication layer. |
4. Explanatory footnotes are part of the method
“Moderate certainty” does not tell the reader why confidence was reduced. An explanation should identify the relevant domain and the evidence that made the concern serious enough to change the rating. Guidance on GRADE explanatory footnotes emphasizes specificity and auditability: the note should help another reader understand the judgment rather than merely name a domain.9
Too vague
“Downgraded for quality issues.” The problem is not identifiable, and the judgment cannot be reconstructed.
Methodologically useful
“Downgraded one level for imprecision because the 95% confidence interval includes both an important benefit and little or no benefit relative to the prespecified threshold.”
The wording should also avoid converting certainty into an effect statement. “Low certainty” is not another way of saying “no effect.” The effect estimate and the certainty judgment answer different questions and should remain grammatically distinct.
5. A reproducible workflow for constructing the table
6. Difficult cases should remain visible rather than being simplified away
Some evidence does not fit a simple risk-ratio row. If meta-analysis is not possible, the outcome can still be reported and certainty can still be assessed. If no data were found for a prioritized outcome, the absence itself should be visible. Multiple time points, doses or comparisons should be handled according to the prespecified decision problem rather than by expanding one primary table until its purpose is lost.2
Mixed randomized and observational evidence may require separate presentation when neither body clearly dominates. Network meta-analysis uses specialist certainty methods and should not be forced into a pairwise SoF workflow without the relevant extension. Time-to-event outcomes can require additional assumptions to translate relative effects into absolute effects at defined time points. These are not reasons to omit the outcome; they are reasons to make the analytical route explicit.
7. Software can organize the workflow, but it cannot supply the judgment
GRADEpro GDT is the standard tool used in Cochrane-linked workflows to create evidence profiles and Summary of Findings tables. It can calculate corresponding absolute risks from selected inputs, structure certainty judgments and export tables. The methodological decisions remain with the review team: which outcomes matter, which baseline risk is appropriate, whether a domain warrants rating down, how a footnote should explain that judgment, and whether a transformation is interpretable.11
This separation is important for reproducibility. A table generated by recognized software is not automatically a correctly applied GRADE table. The GRADE guidance group’s methodological requirements emphasize explicit domain judgments, standard certainty categories and transparent evidence tables rather than software provenance alone.13
8. Common errors change the meaning of the evidence
| Error | Why it matters | Correction |
|---|---|---|
| Only the relative effect is reported | The same RR can imply very different absolute consequences at different baseline risks. | Present an appropriate absolute effect and document the baseline risk used. |
| Outcomes are selected after results are known | The table can become a showcase of favourable or precise findings rather than the outcomes that matter. | Prioritize critical and important outcomes independently of results. |
| A surrogate is presented as a patient-important outcome | The evidence appears more directly relevant than it is. | Label the surrogate as a substitute and consider the indirectness implications. |
| One GRADE label is assigned to the entire review | Different outcomes can rely on different evidence and have different limitations. | Rate certainty separately for each outcome-level body of evidence. |
| “Downgraded for imprecision” is the entire footnote | The reader cannot see what threshold or interval made the concern serious. | State the reason, consequence and level of rating change. |
| Seven outcomes are treated as a quota | Low-priority information displaces clarity. | Use seven or fewer; include only outcomes that warrant prominence. |
| High certainty is interpreted as a recommendation | Certainty does not incorporate all values, resources, equity, acceptability or feasibility considerations. | Keep the evidence summary separate from the Evidence-to-Decision judgment.14 |
9. Worked reasoning: three hypothetical outcomes
Consider a hypothetical review of add-on combination inhaler therapy versus inhaled corticosteroid monotherapy for adults with moderate persistent asthma. Suppose the review team prioritizes exacerbations requiring oral corticosteroids, asthma-control score and oral candidiasis. These values are illustrative only and are not taken from clinical studies.
For exacerbations, assume a baseline risk of 250 per 1,000 and a hypothetical RR of 0.70 (95% CI 0.55–0.89). The same relative estimate becomes interpretable when expressed as an absolute difference: approximately 75 fewer exacerbations per 1,000, with an interval derived from the relative-effect confidence limits. If certainty is rated moderate, the footnote must explain the specific limitation that led to the downgrade. The table should not simply attach the word “moderate” to the row.
For a continuous asthma-control score, suppose the hypothetical mean difference is −0.35 points on a 0–6 scale where lower values are better and the minimally important difference is 0.5. The numerical direction alone is not enough. The reader needs the scale, direction and an interpretive anchor to understand whether the average difference is likely to be important.8
For oral candidiasis, an uncommon harm, the baseline risk may be only 20 per 1,000. Even a comparatively large relative increase can therefore correspond to a modest absolute increase. This is exactly why benefit and harm rows should not rely on relative effects alone.
10. The table should lead to interpretation, not to a recommendation
A well-constructed SoF table makes the evidence easier to inspect. It does not decide what should be done. Recommendation development considers additional criteria, including the balance of benefits and harms, values and preferences, resource use, equity, acceptability and feasibility. Core GRADE therefore separates evidence presentation from the subsequent Evidence-to-Decision process.14
The strongest SoF tables are compact because the work behind them is not. They expose the outcomes, effect magnitude, absolute consequences, certainty and essential rationale while preserving a deeper audit trail in the evidence profile and review methods. That combination of brevity and recoverable reasoning is what turns the table from a summary into a defensible evidence-communication instrument.
GRADE Summary of Findings methods
Frequently asked questions
What is the difference between a Summary of Findings table and a normal results table?
A normal results table may report study or meta-analysis estimates without prioritizing patient-important outcomes, translating relative effects into absolute consequences, or reporting certainty. A GRADE SoF table is designed around those interpretive tasks and links each prioritized outcome to its certainty and essential explanation.1–3
Why is baseline risk so important?
Because the same relative effect can correspond to very different absolute benefits or harms at different starting risks. Baseline risk determines the absolute meaning of a relative effect for a target population, so its selection must be methodologically justified rather than accepted as a software default.1,5
Should all five GRADE domains appear in the SoF table?
Can a systematic review have different certainty ratings for different outcomes?
Yes. Certainty is rated for the body of evidence contributing to each outcome. Different outcomes may rely on different studies, instruments, event counts or assumptions, so one review can legitimately contain high-certainty evidence for one outcome and low-certainty evidence for another.6
What should I do when meta-analysis is not possible?
Do not assume that the outcome disappears from GRADE. A prioritized outcome can still be described narratively and its certainty assessed, provided the evidence and limitations can be characterized. The lack of a pooled estimate should be made explicit rather than hidden by omission.
Does GRADEpro decide which certainty rating is correct?
Does a high-certainty SoF result imply a strong recommendation?
No. Certainty is one input to a recommendation. Evidence-to-Decision frameworks additionally consider benefits and harms, values, resources, equity, acceptability and feasibility. The SoF table should communicate the evidence without collapsing that later decision process into the table.14
Source record
References
References follow Vancouver order of first citation with superscript Nature-style numbering in the article.
- Guyatt G, Yao L, Murad MH, Hultcrantz M, Agoritsas T, De Beer H, et al. Core GRADE 6: presenting the evidence in summary of findings tables. BMJ. 2025;389:e083866. doi:10.1136/bmj-2024-083866.
- Schünemann HJ, Higgins JPT, Vist GE, Glasziou P, Akl EA, Skoetz N, Guyatt GH. Chapter 14: Completing “Summary of findings” tables and grading the certainty of the evidence. In: Higgins JPT, Thomas J, Chandler J, Cumpston M, Li T, Page MJ, Welch VA, editors. Cochrane Handbook for Systematic Reviews of Interventions. Current online version. Cochrane. Available from: Cochrane Handbook Chapter 14.
- Guyatt G, Oxman AD, Akl EA, Kunz R, Vist G, Brozek J, et al. GRADE guidelines: 1. Introduction—GRADE evidence profiles and summary of findings tables. J Clin Epidemiol. 2011;64(4):383–394. doi:10.1016/j.jclinepi.2010.04.026.
- Rosenbaum SE, Glenton C, Oxman AD. Summary-of-findings tables in Cochrane reviews improved understanding and rapid retrieval of key information. J Clin Epidemiol. 2010;63(6):620–626. doi:10.1016/j.jclinepi.2009.12.014.
- Guyatt GH, Oxman AD, Santesso N, Helfand M, Vist G, Kunz R, et al. GRADE guidelines: 12. Preparing Summary of Findings tables—binary outcomes. J Clin Epidemiol. 2013;66(2):158–172. doi:10.1016/j.jclinepi.2012.01.012.
- Guyatt G, Agoritsas T, Brignardello-Petersen R, et al. Core GRADE 1: overview of the Core GRADE approach. BMJ. 2025;389:e081903. doi:10.1136/bmj-2024-081903.
- Balshem H, Helfand M, Schünemann HJ, Oxman AD, Kunz R, Brozek J, et al. GRADE guidelines: 3. Rating the quality of evidence. J Clin Epidemiol. 2011;64(4):401–406. doi:10.1016/j.jclinepi.2010.07.015.
- Guyatt GH, Thorlund K, Oxman AD, Walter SD, Patrick D, Furukawa TA, et al. GRADE guidelines: 13. Preparing summary of findings tables and evidence profiles—continuous outcomes. J Clin Epidemiol. 2013;66(2):173–183. doi:10.1016/j.jclinepi.2012.08.001.
- Santesso N, Carrasco-Labra A, Langendam M, Brignardello-Petersen R, Mustafa RA, Heus P, et al. Improving GRADE evidence tables part 3: detailed guidance for explanatory footnotes supports creating and understanding GRADE certainty in the evidence judgments. J Clin Epidemiol. 2016;74:28–39. doi:10.1016/j.jclinepi.2015.12.006.
- Langendam MW, Akl EA, Dahm P, Glasziou P, Guyatt G, Schünemann HJ. Assessing and presenting summaries of evidence in Cochrane Reviews. Syst Rev. 2013;2:81. doi:10.1186/2046-4053-2-81.
- Cochrane GRADEing Methods Group. GRADEpro GDT. Cochrane Methods. Available from: GRADEpro GDT. User documentation: GRADEpro GDT User Guide.
- Carrasco-Labra A, Brignardello-Petersen R, Santesso N, Neumann I, Mustafa RA, Mbuagbaw L, et al. Improving GRADE evidence tables part 1: a randomized trial shows improved understanding of content in summary of findings tables with a new format. J Clin Epidemiol. 2016;74:7–18. doi:10.1016/j.jclinepi.2015.12.007.
- Schünemann HJ, Brennan S, Akl EA, Hultcrantz M, Alonso-Coello P, Xia J, et al. The development methods of official GRADE articles and requirements for claiming the use of GRADE: a statement by the GRADE guidance group. J Clin Epidemiol. 2023;159:79–84. doi:10.1016/j.jclinepi.2023.05.010.
- Guyatt G, et al. Core GRADE 7: principles for moving from evidence to recommendations and decisions. BMJ. 2025;389:e083867. doi:10.1136/bmj-2024-083867.

