
Funnel Plots and Egger’s Test: Interpretation, Limitations and Small-Study Effects
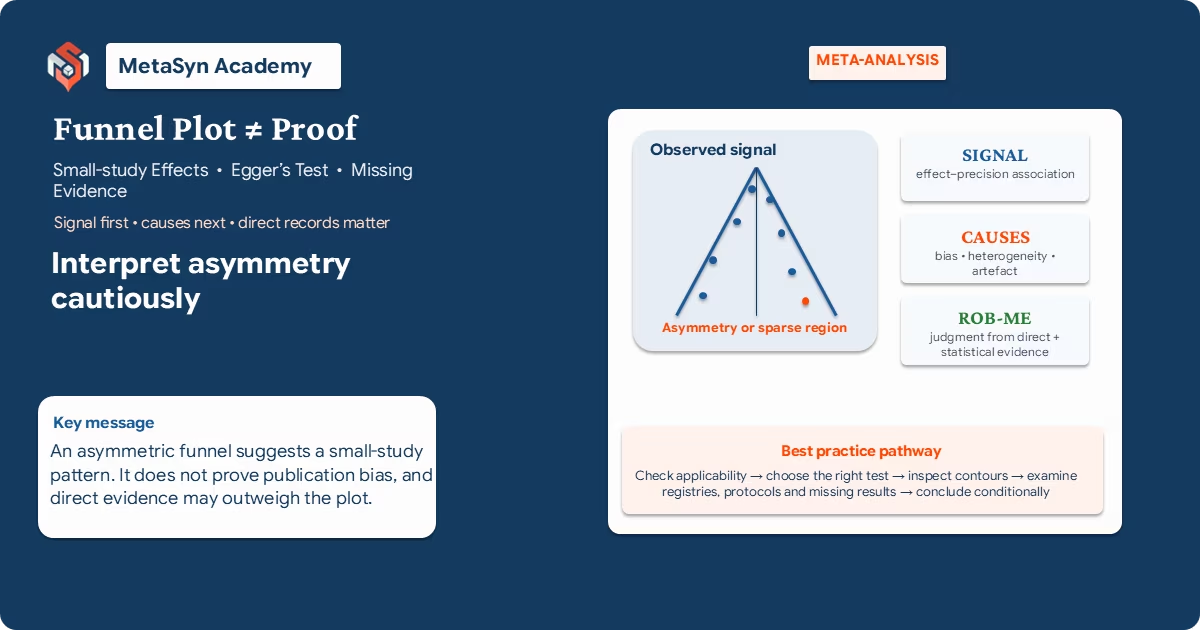
Funnel plots and regression tests for asymmetry are among the most familiar tools in meta-analysis and among the most overinterpreted. An asymmetric display is often reported as proof of publication bias; a non-significant test is taken to show that bias is absent; and an adjusted estimate is presented as if it recovered the result that would have been observed from a complete evidence base. None of these conclusions follows from the methods alone.1–3
The defensible target is narrower and more useful. A funnel plot examines whether effect estimates vary systematically with study size or precision. A formal test asks whether that association is greater than expected by chance under a specified model. Either may indicate a small-study pattern, but neither identifies the mechanism that produced it. Selective non-publication and selective non-reporting are possible causes, alongside risk-of-bias differences, genuine heterogeneity related to study size, sparse data, effect-measure artefacts, influential studies and chance.1,2,7
1. Small-study effects are not synonymous with publication bias
Small-study effects are systematic differences between the results of smaller or less precise studies and those of larger or more precise studies. The smaller studies often report larger effects, but the defining feature is an association with size or precision, not a particular direction. Publication bias is narrower: it concerns selective availability of entire studies because of their results. Bias due to missing evidence can also arise when eligible outcomes, time points or analyses are unavailable selectively within studies.2,13
This distinction changes the permitted inference. A small-study pattern can arise because smaller studies were conducted in higher-risk populations, used more intensive interventions, had shorter follow-up, or were at greater risk of bias. It can also arise mechanically when an effect estimate is correlated with its estimated standard error. The same visual pattern can therefore support several incompatible explanations. A funnel plot contributes evidence about the pattern; it cannot decide among the mechanisms by itself.1,2,7
2. What a funnel plot shows and what its triangle does not mean
A conventional funnel plot places each study’s effect estimate on the horizontal axis and a measure of precision, often the standard error, on the vertical axis, commonly reversed so that more precise studies appear near the top. Ratio measures should be plotted on a logarithmic scale. Under simplified conditions, more precise estimates cluster near the reference effect while less precise estimates disperse more widely, producing an inverted funnel.1,2,4
The triangular boundaries often drawn around the reference line are approximate pseudo-confidence limits. They represent the sampling variation expected around a reference effect under simplified assumptions, commonly including no heterogeneity and no small-study effects. They are not ordinary confidence intervals for the individual study effects, and they should not be presented as limits within which 95% of all future studies must fall. Substantial heterogeneity, dependence, sparse data and an inappropriate effect scale can make the triangle misleading.
3. Applicability comes before interpretation
The most important question is often whether the funnel plot or formal test can carry an inference at all. Tests for asymmetry usually have low power, and current Cochrane guidance retains the rule of thumb that they should generally be used only when at least ten studies are included. Ten is not a validity threshold: power may remain weak above ten, especially when heterogeneity is substantial or the range of study precision is narrow. Tests should not be used when studies have similar standard errors because the data contain little information about a size-related trend.1,2,5
Visual interpretation also becomes unreliable in sparse evidence bases. A plot with fewer than about ten studies may be displayed descriptively for transparency, but it should not support a categorical statement that asymmetry is present or absent. The study count should refer to independent studies or clusters, not the number of correlated effect estimates. Multiple outcomes or time points from the same study do not create additional independent evidence for a funnel-plot test.
4. Test selection is effect-measure-specific
Egger’s original regression test evaluates whether a standardized effect is associated with precision. It is influential and useful in appropriate settings, but it is not a universal test of publication bias. The test estimates a model-specific association and is vulnerable to low power, heterogeneity, influential observations and structural relationships between effect estimates and their standard errors.3,5
| Synthesis setting | Methodological consideration | Interpretive boundary |
|---|---|---|
| Mean difference | An Egger-type regression may be considered when the applicability conditions are met and the model is specified transparently. | A significant result indicates a precision–effect association under the fitted model, not publication bias. |
| Standardized mean difference | The standard SMD-versus-standard-error funnel and unmodified Egger test can be distorted because the SMD and its standard error are structurally related. A sample-size-based precision axis or an SMD-specific method may be more defensible. | Do not apply the original Egger test automatically to SMDs.7 |
| Odds ratio | Harbord- and Peters-type tests were developed to reduce artefactual association in binary outcomes. Their performance still depends on event rates, heterogeneity and study-size patterns. | Neither method is universally valid for all sparse or heterogeneous binary datasets.5,6 |
| Risk ratio or risk difference | Method choice should be justified for the chosen measure and event structure rather than transferred automatically from odds-ratio guidance. | Sparse events and zero cells may dominate the apparent pattern. |
| Diagnostic test accuracy | Conventional intervention-meta-analysis tests can be seriously misleading. A design-specific approach such as the Deeks effective-sample-size regression is commonly used. | Threshold effects and diagnostic heterogeneity still limit interpretation.8 |
| Dependent or multilevel effects | Naively treating correlated estimates as independent invalidates standard errors and study-count assumptions. A specialist multilevel or cluster-robust method is required. | The independent unit must be the study or cluster, not each effect estimate. |
A non-significant test means that the specified association was not detected with the available information. It does not establish symmetry, completeness or low risk of missing-evidence bias. A significant result means that an association was detected; it does not identify selective publication as its cause. Report the exact test, regression predictor, weighting or variance model, statistic, degrees of freedom, p-value, software, version and non-default settings.
5. Contour enhancement changes the attribution question
Contour-enhanced funnel plots overlay regions associated with conventional statistical-significance thresholds. Their purpose is not to improve the detection of asymmetry, but to examine whether the apparent sparsity is located mainly in regions where results would be statistically non-significant or in regions where they would remain highly significant.9
If the apparent gap lies mainly in a non-significant region and in a direction unfavourable to the intervention or hypothesis, significance-related selection becomes more plausible. If the apparent gap lies in a highly significant region, that mechanism becomes less plausible and attention should shift toward heterogeneity, bias within studies, sparse-data behaviour, effect-measure artefacts or chance. These are changes in relative plausibility, not diagnoses. Contours do not reveal, count or reconstruct unobserved studies.
Apparent sparsity in a non-significant region
The location can increase the plausibility of significance-related selection, but it does not demonstrate that eligible studies or results are missing.
Apparent sparsity in a highly significant region
The location can reduce the plausibility of significance-driven suppression and direct attention toward alternative mechanisms.
6. Direct evidence can outweigh a statistical pattern
Funnel plots and asymmetry tests use only the results that are available for analysis. Trial registries, protocols, statistical analysis plans, regulatory submissions, sponsor records, dissertations and correspondence can provide direct evidence that eligible studies or results exist but are unavailable. This evidence addresses the reporting process itself and may be more probative than a weak or ambiguous size-related pattern.2,13,14
ROB-ME integrates known missing results within identified studies, potential missing studies across the review and statistical indications of small-study effects into a structured judgment for a specific meta-analysis result. Its categories are low risk, some concerns and high risk of bias due to missing evidence. The tool can support high concern despite an inconclusive funnel plot when direct records indicate selective unavailability. Conversely, an inception cohort showing that all initiated studies and eligible results were available can support low risk despite funnel asymmetry, while the cause of the asymmetry is investigated separately.2,14
7. Adjustment methods are sensitivity models, not corrections
Trim-and-fill estimates how a pooled result would change under a symmetry-restoring imputation procedure. It can be informative as a scenario, but it assumes that asymmetry can be represented by a particular pattern of missing studies and can behave poorly when asymmetry is caused by heterogeneity, outliers or an incorrect selection direction.10,11 The imputed studies are hypothetical model components, not discovered evidence.
Selection models specify a relationship between the probability of availability and features such as the study’s p-value, direction or magnitude. Regression-based methods extrapolate the relationship between effect and precision toward a large or infinitely precise study. p-value-based methods model the distribution of reported significance levels. Bayesian model averaging can average across several effect, heterogeneity and selection specifications rather than selecting one model as certainly correct.12
These approaches answer different counterfactual questions and rely on assumptions that are often weakly identified by a modest number of studies. Their estimates may diverge substantially, and convergence does not establish that the assumed selection mechanism is true. A rigorous report retains the observed synthesis, identifies every adjustment as a prespecified or post hoc sensitivity scenario, states the mechanism assumed and shows how conclusions change across plausible alternatives.
Write: “under the specified symmetry-restoring or selection-model scenario, the estimated effect changed from … to …; the result depends on the stated assumptions.”
8. Heterogeneity, influence and dependence can imitate asymmetry
Heterogeneity can create funnel asymmetry when study size is associated with population, intervention, outcome, follow-up, baseline risk or study quality. The overall plot may be asymmetric even when plots within coherent subgroups are not. Before invoking missing evidence, examine whether smaller and larger studies differ systematically in the scientific question they answer.1,2
A single influential study can also determine the visual pattern or test result. Influence diagnostics and leave-one-study-out analyses help identify this dependence, but influence is not evidence of error and does not justify deletion. If several effect estimates come from the same study, the plot and test must respect the study-level clustering. Counting correlated effects as separate studies inflates the apparent information and invalidates ordinary regression standard errors.
Where small-study effects are suspected in a heterogeneous random-effects synthesis, comparing common-effect and random-effects estimates can be informative because random-effects weights give relatively more influence to smaller studies. A larger shift in the random-effects estimate toward the smaller-study results may indicate that the pattern affects the pooled mean, but this comparison remains a sensitivity analysis rather than a test of publication bias.2
9. Reporting language that matches the method
PRISMA 2020 requires authors to describe methods used to assess risk of bias due to missing results and to report the resulting assessments. A complete report should identify the synthesis assessed, study count, effect measure, plot axes, reference line, pseudo-limits and contours; state why the formal test was applicable; name the exact test and software; report the statistic and uncertainty; summarize competing explanations and direct missing-evidence records; and provide the final ROB-ME or other framework-based judgment where applicable.15,16
Preferred wording separates observation from attribution:
| Overclaim | Defensible alternative |
|---|---|
| “The funnel plot showed publication bias.” | “The funnel plot was asymmetric, indicating a possible small-study pattern; several mechanisms remained plausible.” |
| “Egger’s test showed no publication bias.” | “The specified test did not detect a precision–effect association; limited power and alternative forms of missing evidence remain.” |
| “Publication bias was corrected using trim-and-fill.” | “A trim-and-fill sensitivity scenario changed the estimate from … to … under its symmetry assumptions.” |
| “The evidence base was complete.” | “No missing eligible studies or results were identified from the sources examined; residual uncertainty is described.” |
The strongest conclusion is often conditional rather than categorical: an effect–precision association was or was not detected; the plot pattern was more compatible with some explanations than others; direct evidence did or did not identify missing results; and the defined meta-analysis was judged at low risk, with some concerns or at high risk of bias due to missing evidence.
Related methodological articles and research tools
Funnel plot and small-study effects interpretation checklist
Document applicability, plot construction, visual features, test selection, direct missing-evidence records, sensitivity scenarios and the final judgment.
Open the interpretation checklist → Methodological overviewMeta-analysis heterogeneity, sensitivity analysis and publication bias
Examine how heterogeneity, robustness checks, influence diagnostics, small-study effects and missing-evidence assessment fit together.
Read the methodological overview → Research templatesSystematic review and meta-analysis templates
Access evidence-informed worksheets, diagnostic logs, protocol-planning tools and reporting resources for systematic reviews.
Browse the research templates →Frequently asked questions
Does an asymmetric funnel plot prove publication bias?
No. Asymmetry can arise from missing evidence, bias within smaller studies, true heterogeneity associated with study size, sparse data, effect-measure artefacts, influential studies or chance. The plot identifies a pattern; attribution requires the study context, direct records and an appropriate risk-of-bias framework.1,2
Can a non-significant Egger test show that publication bias is unlikely?
No. Tests of funnel-plot asymmetry generally have low power, particularly with few studies or little variation in precision. A non-significant result means that the specified association was not detected under the fitted model; it does not exclude selective non-publication, selective non-reporting or other forms of missing evidence.1–3
Which asymmetry test should be used for odds ratios?
The original Egger test is generally not recommended for odds ratios because the estimate and its standard error can be artefactually related. Harbord- and Peters-type tests were developed for binary outcomes, but their performance still depends on event rates, heterogeneity and study-size patterns. The exact choice should be justified rather than treated as a universal default.1,5,6
Can I use the standard Egger test for a standardized mean difference?
Not automatically. Standardized mean differences can be structurally correlated with their standard errors, distorting conventional funnels and producing false indications of asymmetry. A sample-size-based precision measure or another SMD-specific approach should be considered and documented.7
Does trim-and-fill provide the true effect corrected for publication bias?
No. Trim-and-fill estimates a sensitivity scenario under a symmetry-restoring imputation mechanism. Heterogeneity, outliers and an incorrect assumed selection direction can produce misleading results. The observed synthesis should remain visible, and the adjusted estimate should be labelled as conditional on its assumptions.10,11
Should I draw a funnel plot when only six studies are available?
It may be shown descriptively with an explicit warning, but it is unlikely to support reliable visual or formal inference. Tests are generally discouraged below about ten studies, and the evidence may remain uninformative even above ten when study precisions are similar or heterogeneity is substantial.1,2
References
- Sterne JAC, Sutton AJ, Ioannidis JPA, et al. Recommendations for examining and interpreting funnel plot asymmetry in meta-analyses of randomised controlled trials. BMJ. 2011;343:d4002. doi:10.1136/bmj.d4002.
- Page MJ, Higgins JPT, Sterne JAC. Chapter 13: Assessing risk of bias due to missing evidence in a meta-analysis. In: Cochrane Handbook for Systematic Reviews of Interventions. Version 6.5; last updated August 2024. Cochrane; 2024. Available from: Cochrane Handbook Chapter 13.
- Egger M, Davey Smith G, Schneider M, Minder C. Bias in meta-analysis detected by a simple, graphical test. BMJ. 1997;315(7109):629–634. doi:10.1136/bmj.315.7109.629.
- Sterne JAC, Egger M. Funnel plots for detecting bias in meta-analysis: guidelines on choice of axis. J Clin Epidemiol. 2001;54(10):1046–1055. doi:10.1016/S0895-4356(01)00377-8.
- Harbord RM, Egger M, Sterne JAC. A modified test for small-study effects in meta-analyses of controlled trials with binary endpoints. Stat Med. 2006;25(20):3443–3457. doi:10.1002/sim.2380.
- Peters JL, Sutton AJ, Jones DR, Abrams KR, Rushton L. Comparison of two methods to detect publication bias in meta-analysis. JAMA. 2006;295(6):676–680. doi:10.1001/jama.295.6.676.
- Zwetsloot PP, van der Naald M, Sena ES, et al. Standardized mean differences cause funnel plot distortion in publication bias assessments. eLife. 2017;6:e24260. doi:10.7554/eLife.24260.
- Deeks JJ, Macaskill P, Irwig L. The performance of tests of publication bias and other sample size effects in systematic reviews of diagnostic test accuracy was assessed. J Clin Epidemiol. 2005;58(9):882–893. doi:10.1016/j.jclinepi.2005.01.016.
- Peters JL, Sutton AJ, Jones DR, Abrams KR, Rushton L. Contour-enhanced meta-analysis funnel plots help distinguish publication bias from other causes of asymmetry. J Clin Epidemiol. 2008;61(10):991–996. doi:10.1016/j.jclinepi.2007.11.010.
- Duval S, Tweedie R. Trim and fill: a simple funnel-plot-based method of testing and adjusting for publication bias in meta-analysis. Biometrics. 2000;56(2):455–463. doi:10.1111/j.0006-341X.2000.00455.x.
- Shi L, Lin L. The trim-and-fill method for publication bias: practical guidelines and recommendations based on a large database of meta-analyses. Medicine (Baltimore). 2019;98(23):e15987. doi:10.1097/MD.0000000000015987.
- Bartoš F, Maier M, Quintana DS, Wagenmakers EJ. Robust Bayesian meta-analysis: model-averaging across complementary publication bias adjustment methods. Res Synth Methods. 2023;14(1):99–116. doi:10.1002/jrsm.1594.
- Page MJ, McKenzie JE, Higgins JPT. Bias due to selective inclusion and reporting of outcomes and analyses in systematic reviews of randomised trials of healthcare interventions. Cochrane Database Syst Rev. 2014;(10):MR000035. doi:10.1002/14651858.MR000035.pub2.
- Page MJ, Sterne JAC, Boutron I, et al. ROB-ME: a tool for assessing risk of bias due to missing evidence in systematic reviews with meta-analysis. BMJ. 2023;383:e076754. doi:10.1136/bmj-2023-076754.
- Page MJ, McKenzie JE, Bossuyt PM, et al. The PRISMA 2020 statement: an updated guideline for reporting systematic reviews. BMJ. 2021;372:n71. doi:10.1136/bmj.n71.
- Page MJ, Moher D, Bossuyt PM, et al. PRISMA 2020 explanation and elaboration: updated guidance and exemplars for reporting systematic reviews. BMJ. 2021;372:n160. doi:10.1136/bmj.n160.

