
Sensitivity Analysis and Leave-One-Out Analysis in Meta-Analysis
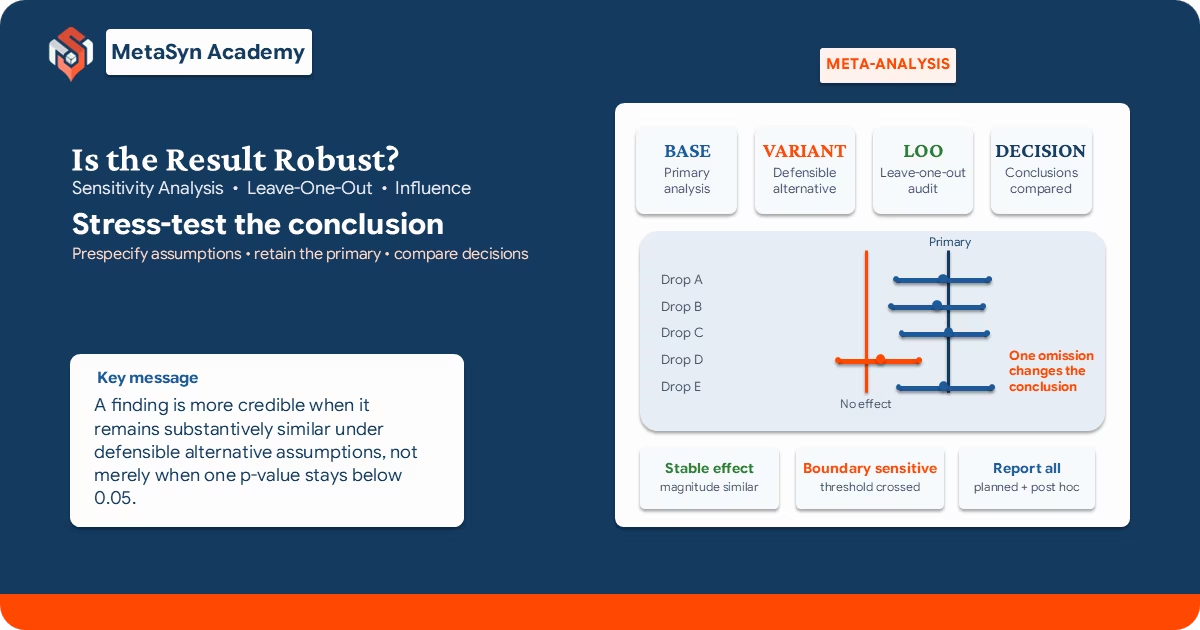
A meta-analysis rarely has only one defensible implementation. Eligibility boundaries can be uncertain, missing outcomes require assumptions, effect measures and heterogeneity estimators may have reasonable alternatives, and one study can contribute disproportionate information. Sensitivity analysis examines whether the substantive conclusion depends on these choices. Its purpose is not to search for a preferred result, but to expose the consequences of uncertainty in the review process.1,2
Leave-one-out analysis is one member of this broader family. It refits the synthesis after omitting each independent study or cluster in turn and shows how the estimate, interval and heterogeneity change. The method can reveal dependence on one study, but it does not test every analytical assumption, establish that an influential study is erroneous, or prove robustness when no omission crosses the statistical null. Robustness is multidimensional: effect magnitude, uncertainty, prediction, heterogeneity and decision-relevant conclusions may respond differently to the same analytical change.
1. Sensitivity analysis is an assumption stress test
The Cochrane Handbook defines sensitivity analysis as repeating the primary analysis while substituting alternative decisions or ranges of values for choices that were arbitrary, unclear or based on unverifiable assumptions. Examples include uncertain eligibility, studies at high risk of bias, imputed data, missing outcomes and alternative statistical methods.1 The 2026 Cochrane tutorial provides practical examples and emphasizes interpretation, reporting and the distinction from subgroup analysis; its examples should not be treated as an official exhaustive taxonomy.2
Three elements determine whether the exercise is informative. First, the primary analysis must be specified clearly enough to serve as a stable reference. Second, every alternative must have a scientific rationale independent of the result it produces. Third, the comparison must be assessed against prespecified substantive criteria—not reduced to whether one p-value falls above and another below 0.05.
Subgroup analysis asks whether effects differ across levels of a study characteristic and ordinarily relies on a formal interaction or between-group test. Sensitivity analysis asks whether the same target conclusion changes under an alternative assumption or analytical decision. The analyses may use similar data partitions, but their inferential purposes are different. Primary and sensitivity estimates usually rely on overlapping data and are correlated; a comparison of their separate significance levels is not a valid test of whether they differ.
2. Prespecification, post hoc analyses and analytical multiplicity
Prespecification reduces the opportunity to select an analysis after seeing its result. It does not require predicting every problem that will emerge during a review. Unanticipated data errors, model failures or previously unknown design features may justify additional analyses, but these should be labelled post hoc, explained and reported alongside the prespecified analyses.
PRISMA 2020 Item 13f asks authors to describe methods used to assess robustness through sensitivity analysis; Item 20d asks for the results of all sensitivity analyses conducted; and Item 24c asks authors to describe and explain amendments to registration or protocol information.3,4 PRISMA is a reporting guideline, not a guarantee that the analysis was statistically valid.
The analysis plan should state which uncertainty each alternative addresses, the direction or range of change, and the criterion by which the result will be considered materially different. Without such boundaries, a sensitivity exercise can become an unreported multiverse in which many specifications are tried and only a selected subset reaches the manuscript. Transparency requires a run log that includes analyses that strengthen, weaken and leave the conclusion unchanged.
| Assumption class | Examples of defensible alternatives | Question answered |
|---|---|---|
| Eligibility and estimand | Exclude borderline populations, interventions, outcomes, time points or designs using a rule defined independently of results. | Does the conclusion depend on a disputed boundary or an estimand mismatch? |
| Risk of bias | Restrict to studies meeting a prespecified risk-of-bias criterion or apply a justified bias-adjustment model. | Does the conclusion rely on studies at greater risk of systematic error? |
| Missing data | Vary imputed event counts, outcome shifts, correlation assumptions or missing-not-at-random parameters. | How strongly does the result depend on unverifiable missingness assumptions? |
| Effect-size construction | Alternative correlation values, continuity corrections, scale transformations or defensible effect measures. | Do measurement and computational choices drive the conclusion? |
| Statistical model | Alternative heterogeneity estimators, interval procedures, random-effects distributions or dependence models. | Are inferential conclusions stable across reasonable model specifications? |
| Study influence | Leave-one-study-out, leave-one-cluster-out, verified-error correction or prespecified exclusion scenarios. | Does one study or independent cluster disproportionately determine the conclusion? |
3. What leave-one-out analysis computes
For a synthesis containing k independent studies, a leave-one-out analysis fits k additional models. Each model omits one study and recomputes the summary estimate and, where applicable, its confidence interval, heterogeneity statistics and prediction interval. The display is most useful when all reanalyses are shown on the same effect scale and compared with prespecified decision boundaries as well as the full-data estimate.5,24
The unit omitted must match the unit of independence. If one trial contributes several correlated effect estimates, deleting one effect at a time is not a leave-one-study-out analysis and can leave most of that trial’s information in the model. Multilevel, multivariate or robust-variance syntheses generally require deletion of the full study cluster and model-specific recalculation.
Leave-one-out analysis answers a narrow question: does any single independent study or cluster materially affect the fitted result? It cannot establish robustness to missing-data assumptions, effect-measure choices, alternative eligibility rules or combinations of influential studies. When several unusual studies are present, each single-deletion refit retains the others; this can mask or distort their apparent influence. Iterative procedures have been proposed for these multi-outlier configurations, but they are method-specific and should be reported as such.6
4. Outlyingness, leverage and influence are different properties
Influence diagnostics extend familiar regression concepts to common-effect, random-effects and mixed-effects meta-analytic models.5 A studentized deleted residual asks how inconsistent a study is with the model fitted to the remaining data. A hat value describes leverage—the degree to which the fitted value is tied to that observation. DFBETAS quantify the standardized change in individual model coefficients after deletion. Cook-type distances summarize broader changes in the fitted coefficient vector. Covariance ratios assess changes in coefficient uncertainty.
These measures need not agree. A large, precise trial may be highly influential because it contains substantial information while fitting the model well. A small study may have a large residual but little influence on the summary. A Baujat plot displays each study’s contribution to Q against its influence on the pooled estimate, helping separate studies that contribute to heterogeneity from those that move the summary.7 GOSH plots examine the distribution of results across many study subsets and can reveal clusters or multimodality that single-deletion diagnostics miss, although the number of possible subsets grows rapidly and approximate sampling may be required.8
5. Exclusion requires a reason independent of the result
An influential study is not necessarily erroneous, biased or ineligible. Routine deletion based on a diagnostic value or on a change in statistical significance is not supported by the methodological literature.5,9 Appropriate next steps are to verify data extraction and direction coding, examine eligibility and estimand alignment, review risk of bias, inspect the study’s design and context, and present analyses with and without the study when the alternative is scientifically defensible.
Removal from the primary analysis is most defensible when a documented reason exists independently of the desired result: a verified data or reporting error that cannot be corrected; confirmed ineligibility; duplication of participants; incompatibility with the prespecified estimand; or a restriction defined in the protocol and applied consistently. A genuine study that differs from the others is evidence about heterogeneity, not an error merely because it changes the answer.
6. Robustness is multidimensional
A pooled point estimate can move very little while its interpretation changes materially. Conversely, a point estimate can move while remaining entirely within the same clinically or policy-relevant range. A defensible robustness judgment should therefore consider at least four dimensions:
A preregistered July 2026 preprint reanalysed 358 behavioural-science meta-analyses under four outlier-handling approaches. The median absolute change in Cohen’s d was no greater than 0.047, yet at least one treatment-estimator combination changed statistical-significance status in 11.5% of meta-analyses and the smallest-effect-of-interest classification in 15.9%. Changes were concentrated near decision boundaries.10 These figures are domain-specific and not peer reviewed, so they should not be treated as universal rates. Their methodological lesson is narrower: stability of magnitude and stability of a categorical conclusion are different properties.
Thresholds should be stated before interpreting the alternatives. Relevant boundaries may include the statistical null, a justified smallest effect size of interest, a minimal clinically important difference, a cost-effectiveness threshold or another decision criterion. If no defensible threshold exists, the report should describe the range of estimates and uncertainty without manufacturing a binary robustness verdict.
7. Missing-data sensitivity analyses test unverifiable assumptions
Missing outcome data create assumptions that cannot be resolved from the observed synthesis alone. Analyses based on missing at random rely on the idea that, conditional on observed information, missingness does not depend on the unobserved outcome. Missing-not-at-random mechanisms allow missingness to depend on the unavailable value itself and therefore require explicit sensitivity parameters or models.11,12
Possible approaches include best-case and worst-case event scenarios, informative missingness parameters for binary or continuous outcomes, pattern-mixture models, delta adjustments, selection models and analyses that vary the correlation or distributional assumptions used in imputation.13 The plausible range should be justified from clinical knowledge, trial data, external evidence or stakeholder input. An extreme scenario can be useful as a boundary check, but it should not be presented as equally plausible to a carefully justified central scenario.
The output should state which studies and outcomes contain missing data, the assumed mechanism, the sensitivity parameter and its scale, the range examined, and the point at which the conclusion changes. Because the missingness mechanism is not identified by the observed data, a sensitivity analysis maps consequences; it does not prove which mechanism generated the missingness.
8. Dependent effect estimates require cluster-level robustness
Multiple outcomes, time points, subscales, comparisons or treatment arms from the same participants are statistically dependent. Treating them as independent can over-weight studies contributing many effects and understate uncertainty. Three-level and multivariate models represent the dependence through explicit variance or covariance components, while robust variance estimation uses a working covariance model and cluster-robust standard errors.14–18
The appropriate method depends on the estimand, the number of independent studies, the complexity of dependence and the availability of plausible correlations. Robust variance inference is asymptotic and requires small-sample corrections when independent clusters are limited; cluster wild bootstrap procedures provide another option for some hypothesis tests.17–19 No method creates information when the number of independent studies is very small.
Sensitivity analyses should vary uncertain within-study correlations or working covariance parameters, compare plausible dependence models and delete full study clusters rather than isolated effects. Reports should distinguish the number of independent studies from the number of effect estimates and identify the unit used for degrees of freedom and deletion.
9. Emerging model-based approaches
Some methods seek robustness within the model rather than through deletion. Variance-shift models allow selected studies to have larger residual variance instead of removing them.20 Robust Bayesian model averaging can combine models with different heterogeneity and selective-reporting assumptions.21 Specification-curve and multiverse approaches enumerate a defined set of theoretically defensible analytical choices and display the resulting distribution of estimates.22,23
These approaches can illuminate model uncertainty, but they do not remove the need to define which specifications are scientifically defensible. Many remain supported primarily by theory, simulation or selected applications rather than broad validation across review types. They should be presented as additional sensitivity frameworks, not as universally superior replacements for prespecified primary analyses.
10. Reproducibility and reporting
Every sensitivity run should preserve the data version, software and package version, function or command, effect measure and transformation, synthesis model, heterogeneity estimator, confidence-interval method, prediction-interval method, covariance assumptions, studies or clusters included, non-default options, warnings and convergence status. Package documentation can help identify what a function computes, but documentation pages change; versioned analytical code and saved output are the durable record.24,25
A publication-ready results section should identify which analyses were prespecified and which were post hoc; present the result of every sensitivity analysis conducted; compare each with the primary analysis using effect magnitude, uncertainty, heterogeneity and prespecified thresholds; and explain what changed in the conclusion. The language should remain conditional: “the conclusion depended on excluding studies at high risk of bias” or “the estimate was stable, but the confidence interval crossed the prespecified decision threshold under the missing-not-at-random scenario.”
Prefer: “the study had high influence under the fitted model; data and eligibility were rechecked, and the prespecified deletion analysis changed the decision-relevant conclusion as follows …”.
Related methodological articles and research tools
Meta-analysis sensitivity analysis planning and results log
Prespecify alternative assumptions, record every analytical run and document whether magnitude, uncertainty or decision-relevant conclusions change.
Open the planning and results log → Methodological overviewMeta-analysis heterogeneity, sensitivity analysis and publication bias
Examine how robustness checks connect with heterogeneity, prediction, influence diagnostics, small-study effects and missing-evidence assessment.
Read the methodological overview → Research templatesSystematic review and meta-analysis templates
Access evidence-informed worksheets, diagnostic logs, protocol-planning tools and reporting resources for systematic reviews.
Browse the research templates →Frequently asked questions
How is a sensitivity analysis different from a subgroup analysis?
A subgroup analysis estimates effects within levels of a study characteristic and usually evaluates effect modification with a formal interaction or between-group test. A sensitivity analysis re-estimates the same target under an alternative assumption or analytical decision. The primary and sensitivity estimates usually use overlapping data, so comparing whether one is statistically significant and the other is not is not a valid test of difference.
Does a leave-one-out analysis prove that a meta-analysis is robust?
No. It addresses only dependence on one omitted independent study or cluster at a time. It does not test missing-data assumptions, eligibility boundaries, effect-size construction, alternative models, combinations of influential studies or dependence misspecification. Robustness must be judged across the defensible assumptions that matter for the review.
Can an outlying or influential study be removed from the primary analysis?
Not because of its numerical influence alone. Influence diagnostics should trigger data checking, methodological review and sensitivity analysis. Exclusion requires a rationale independent of the desired result, such as verified data error, ineligibility, estimand mismatch or a prespecified restriction based on study design or risk of bias.
Is there a universal cutoff for Cook’s distance or DFBETAS in meta-analysis?
No. These diagnostics are model-dependent and commonly used thresholds are conventions rather than universal constants. They are best used to rank studies for scrutiny and to quantify how much fitted quantities change, with the full pattern interpreted alongside residuals, leverage, study precision and substantive characteristics.
Do post hoc sensitivity analyses invalidate a systematic review?
No. Unanticipated data problems or model limitations can justify additional analyses. Their credibility depends on explicit labelling, a clear rationale and complete reporting alongside the prespecified analyses. Selectively reporting only the reassuring post hoc results is the serious problem.
What changes when a study contributes several dependent effect estimates?
The unit of deletion and inference must respect the independent study cluster. Removing one effect while leaving the rest of the same study in the model is not a leave-one-study-out analysis. Depending on the estimand and data structure, analysts may use prespecified effect selection, multivariate or multilevel models, a covariance model, or robust variance estimation with an appropriate small-sample correction.
References
- Deeks JJ, Higgins JPT, Altman DG, McKenzie JE, Veroniki AA, et al. Chapter 10: Analysing data and undertaking meta-analyses, Section 10.14 Sensitivity analyses. In: Cochrane Handbook for Systematic Reviews of Interventions. Current online version. Cochrane. Accessed 5 August 2026. Available from: Cochrane Handbook Chapter 10.
- Aung NM, Jurak I, Mehmood S, Axon E. Sensitivity analysis in meta-analysis: a tutorial. Cochrane Evid Synth Methods. 2026;4(1):e70067. doi:10.1002/cesm.70067. The subsequent correction changed the article category to “Tutorial”; it did not alter the methodological content.
- Page MJ, McKenzie JE, Bossuyt PM, Boutron I, Hoffmann TC, Mulrow CD, et al. The PRISMA 2020 statement: an updated guideline for reporting systematic reviews. BMJ. 2021;372:n71. doi:10.1136/bmj.n71.
- Page MJ, Moher D, Bossuyt PM, Boutron I, Hoffmann TC, Mulrow CD, et al. PRISMA 2020 explanation and elaboration: updated guidance and exemplars for reporting systematic reviews. BMJ. 2021;372:n160. doi:10.1136/bmj.n160.
- Viechtbauer W, Cheung MW-L. Outlier and influence diagnostics for meta-analysis. Res Synth Methods. 2010;1(2):112–125. doi:10.1002/jrsm.11.
- Meng Z, Wang J, Lin L, Wu C. Sensitivity analysis with iterative outlier detection for systematic reviews and meta-analyses. Stat Med. 2024;43(8):1549–1563. doi:10.1002/sim.10008.
- Baujat B, Mahé C, Pignon J-P, Hill C. A graphical method for exploring heterogeneity in meta-analyses: application to a meta-analysis of 65 trials. Stat Med. 2002;21(18):2641–2652. doi:10.1002/sim.1221.
- Olkin I, Dahabreh IJ, Trikalinos TA. GOSH: a graphical display of study heterogeneity. Res Synth Methods. 2012;3(3):214–223. doi:10.1002/jrsm.1053.
- Aguinis H, Gottfredson RK, Joo H. Best-practice recommendations for defining, identifying, and handling outliers. Organ Res Methods. 2013;16(2):270–301. doi:10.1177/1094428112470848.
- Havranek T, Irsova Z, Luskova M, Stanley TD. Do decisions about outliers and influential effects matter? Evidence from 358 behavioral science meta-analyses. arXiv. 2026:2607.23174 [preprint]. Available from: arXiv:2607.23174. Posted 25 July 2026; not peer reviewed at the 5 August 2026 evidence check.
- European Medicines Agency. Guideline on missing data in confirmatory clinical trials. EMA/CPMP/EWP/1776/99 Rev. 1. London: EMA; 2010.
- Carpenter JR, Kenward MG. Multiple Imputation and its Application. Chichester: Wiley; 2013.
- Mavridis D, White IR, Higgins JPT, Cipriani A, Salanti G. Allowing for missing outcome data and incomplete uptake of treatment in meta-analysis. Stat Med. 2015;34(2):205–220. doi:10.1002/sim.6321.
- Cheung MW-L. Modeling dependent effect sizes with three-level meta-analyses: a structural equation modeling approach. Psychol Methods. 2014;19(2):211–229. doi:10.1037/a0032968.
- Van den Noortgate W, López-López JA, Marín-Martínez F, Sánchez-Meca J. Three-level meta-analysis of dependent effect sizes. Behav Res Methods. 2013;45(2):576–594. doi:10.3758/s13428-012-0261-6.
- Hedges LV, Tipton E, Johnson MC. Robust variance estimation in meta-regression with dependent effect size estimates. Res Synth Methods. 2010;1(1):39–65. doi:10.1002/jrsm.5.
- Tipton E. Small sample adjustments for robust variance estimation with meta-regression. Psychol Methods. 2015;20(3):375–393. doi:10.1037/met0000011.
- Pustejovsky JE, Tipton E. Meta-analysis with robust variance estimation: expanding the range of working models. Prev Sci. 2022;23(3):425–438. doi:10.1007/s11121-021-01246-3.
- Joshi M, Pustejovsky JE, Beretvas SN. Cluster wild bootstrapping to handle dependent effect sizes in meta-analysis with a small number of studies. Res Synth Methods. 2022;13(4):457–477. doi:10.1002/jrsm.1554.
- Beath KJ. A random-effects variance shift model for detecting and accommodating outliers in meta-analysis. BMC Med Res Methodol. 2011;11:19. doi:10.1186/1471-2288-11-19.
- Bartoš F, Maier M, Quintana DS, Wagenmakers E-J. Adjusting for publication bias in meta-analysis via robust Bayesian meta-analysis. Meta-Psychology. 2022;6. doi:10.15626/MP.2021.3077.
- Voracek M, Kossmeier M, Tran US. Which data to meta-analyze, and how? A specification-curve and multiverse-analysis approach to meta-analysis. Z Psychol. 2019;227(1):64–82. doi:10.1027/2151-2604/a000357.
- Cuijpers P, Miguel C, Ciharova M, et al. Exploring the efficacy of psychotherapies for depression: a multiverse meta-analysis. BMJ Ment Health. 2023;26(1):e300695. doi:10.1136/bmjment-2023-300695.
- Viechtbauer W. Leave-one-out diagnostics for rma objects. metafor package documentation. Accessed 5 August 2026. Available from: metafor leave1out documentation.
- Viechtbauer W. Influence diagnostics for rma.uni objects. metafor package documentation. Accessed 5 August 2026. Available from: metafor influence diagnostics documentation.

